What the Syndrome chart says
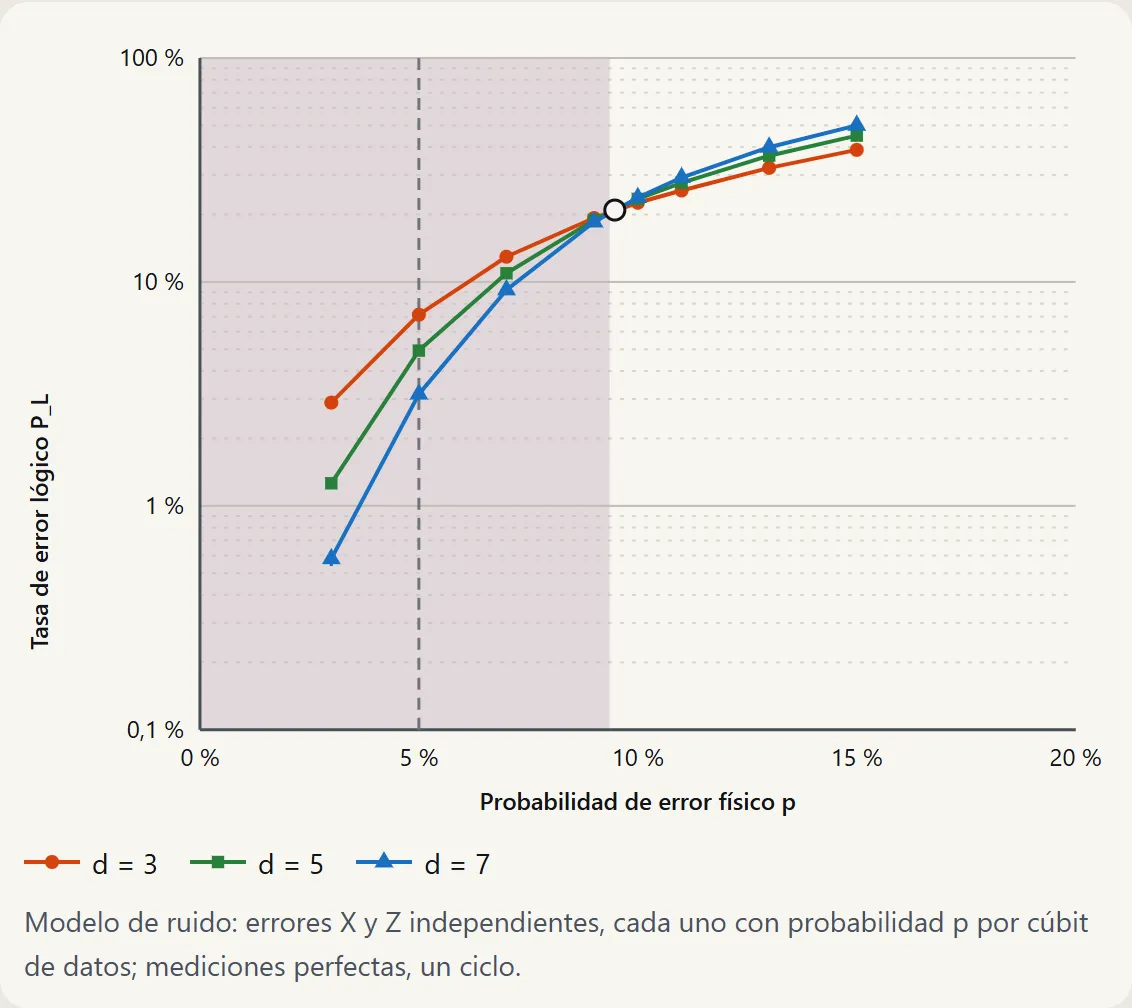
Syndrome's chart sums up in one picture why quantum error correction works: as long as the hardware fails less often than a threshold, a larger code makes fewer logical errors.
What is plotted
- Horizontal axis:
p, the physical error probability: each data qubit suffers an X error with probabilitypand, independently, a Z error with probabilityp(with phenomenological noise, each measurement also fails with that samep). - Vertical axis:
P_L, the fraction of simulated shots that end in a logical error, that is, in which correction fails to protect the information. The scale is logarithmic: on a linear scale the differences that matter, below a few percentage points, would not be visible. - One curve per distance of the rotated surface code: d = 3, 5 and 7 (9, 25 and 49 data qubits). Every point carries its 95% Wilson confidence interval.
How to read it
Left of the crossing, the hardware is good enough: the d = 7 curve lies below the d = 5 curve, and that one below the d = 3 curve. Adding qubits reduces logical errors. For example, with independent noise and p = 5%, the reference simulation measures a logical error rate of 7.122% with d = 3, 4.856% with d = 5 and 3.141% with d = 7, with 10⁵ shots per point.
Right of the crossing the opposite happens: each added qubit brings more chances to fail than capacity to correct, and the larger code does worse. The point where the curves cross is the estimate of the threshold for these sizes.
Where the curves cross
It depends on the noise model. Syndrome has two.
Independent X/Z noise, perfect measurements. Each data qubit suffers an X error with
probability p and, separately, a Z error with probability p; measurements do not fail. The
asymptotic threshold of the minimum-weight perfect matching (MWPM) decoder for this model is
≈10.3% (Wang, Harrington and Preskill, 2003). With d = 3, 5 and 7 the crossing does not land
exactly there, because of the finite size and the boundaries of the code: it is expected between
9% and 11%. In the reference simulation, all three pairs of curves cross in the grid step that runs
from 9% to 10%.
Phenomenological noise: measurements fail too. Over d cycles, the data qubits accumulate errors
and each stabilizer measurement is flipped with the same probability p. The asymptotic threshold
is ≈2.9% (Wang, Harrington and Preskill). For these sizes, the measured crossings fall below it and
depend on the pair of curves: (3, 5) ≈ 2.25%, (3, 7) ≈ 2.50% and (5, 7) ≈ 2.85%.
The crossings are estimated by interpolating between the points of a grid: they give a direction, they do not pin the threshold down to a tenth of a point.
Willow, as context
In the Willow experiment (Google Quantum AI, Nature, 2025), the logical error rate per cycle fell from d = 3 to d = 5 and to d = 7. Fitting those three distances, the paper reports a suppression factor Λ ≈ 2.14: the reduction per step in distance that best describes the three measurements, not a ratio measured step by step. That is real hardware, with a noise model different from Syndrome’s: the figure is context, not something Syndrome reproduces.
Sources
- Syndrome’s validation report, generated on 17 October 2026: reference with PyMatching 2.4.0, and Stim 1.16.0 for the phenomenological model. The Syndrome repository is not public for now.
- Syndrome’s physics conventions (code geometry, decoder weights and noise models), set in Syndrome’s repository, version of 19 October 2026.
- C. Wang, J. Harrington and J. Preskill, “Confinement-Higgs transition in a disordered gauge theory and the accuracy threshold for quantum memory”, Annals of Physics 303, 31 (2003).
- Google Quantum AI, “Quantum error correction below the surface code threshold”, Nature 638, 920–926 (2025).
How Syndrome and the reference are compared: Method.